
🕮5 min read · 825 words
Page speed is not a nice-to-have. It directly affects your Google ranking, your bounce rate, and how many visitors actually become customers.
This is a real case study of how we took a client’s website from a 7.2 second load time to 2.9 seconds in one week — without rebuilding the site from scratch.
The Client
A mid-sized retail business based in Madhya Pradesh with an existing WordPress + WooCommerce website. They came to us after noticing their Google ranking had dropped despite no changes to their content. A quick check revealed their Core Web Vitals scores were failing across the board.
The Problem
Initial audit using Google PageSpeed Insights showed:
| Metric | Before | Target |
|---|---|---|
| Load Time (Mobile) | 7.2 seconds | Under 3s |
| LCP (Largest Contentful Paint) | 6.8s | Under 2.5s |
| CLS (Cumulative Layout Shift) | 0.42 | Under 0.1 |
| FID (First Input Delay) | 380ms | Under 100ms |
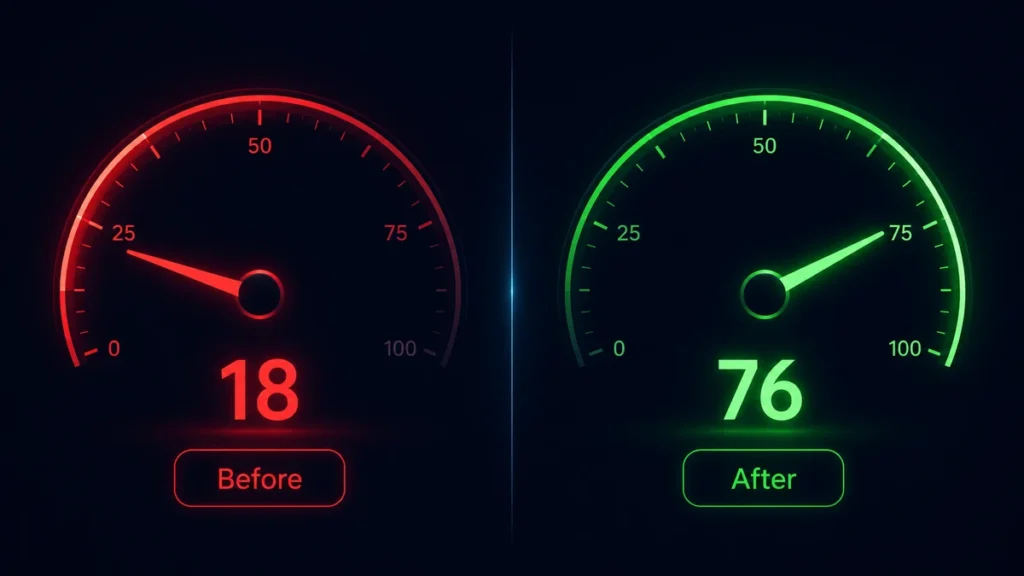
| PageSpeed Score (Mobile) | 18/100 | 70+ |
Root Cause Analysis
We ran a full audit before touching anything. Here’s what we found:
Issue 1 — Unoptimized images. The homepage had 14 product images, all uploaded as full-resolution JPEGs between 2MB and 5MB each. Total image payload: 38MB. On a mobile connection in India, this alone caused a 4+ second delay.
Issue 2 — 23 active plugins. Each plugin was loading its own CSS and JavaScript on every page — including pages where those scripts weren’t needed at all. Total render-blocking scripts: 11.
Issue 3 — No caching. Every page request was hitting the database and rebuilding the page from scratch. With WooCommerce and 800+ products, this was extremely slow.
Issue 4 — No CDN. All assets — images, CSS, JS — were being served from a single shared hosting server in the US, adding 200–400ms of latency for Indian visitors.
Issue 5 — Render-blocking Google Fonts. Four font families were being loaded synchronously in the <head>, blocking page render until all fonts downloaded.
The Fixes — Day by Day
Day 1 — Image Optimization
We installed ShortPixel and bulk-compressed all 800+ product images. Average size reduction: 78%. We also converted all images to WebP format and added lazy loading to all below-the-fold images.
// Added to functions.php for native lazy loading
add_filter('wp_lazy_loading_enabled', '__return_true');
Result: Homepage image payload dropped from 38MB to 4.2MB.
Day 2 — Plugin Audit and Cleanup
We went through all 23 plugins and:
- Deleted 6 plugins that were inactive but still loading assets
- Replaced 3 heavy plugins with lighter alternatives
- Used Asset CleanUp Pro to disable plugin scripts on pages where they weren’t needed
Result: Render-blocking resources dropped from 11 to 2.
Day 3 — Caching Setup
We installed LiteSpeed Cache (the hosting supported LiteSpeed server) and configured:
- Full page caching for all non-cart, non-checkout pages
- Browser caching with 1-year expiry for static assets
- Object caching for database queries
- CSS and JS minification and combination
Result: Time to first byte (TTFB) dropped from 1.8s to 0.3s.
Day 4 — CDN Configuration
We moved the domain to Cloudflare (free plan) and configured:
- All static assets served from Cloudflare’s edge network
- Cloudflare’s Auto Minify for HTML, CSS, and JS
- Rocket Loader for deferred JavaScript execution
- Indian visitors now hit a Mumbai edge node instead of a US server
Result: Average latency for Indian visitors dropped from 380ms to 45ms.
Day 5 — Font and CSS Optimization
We replaced synchronous Google Fonts loading with an async approach:
<!-- Before: blocking -->
<link href="https://fonts.googleapis.com/css2?family=Inter:wght@400;600;700&display=swap" rel="stylesheet">

<!-- After: non-blocking -->
<link rel="preconnect" href="https://fonts.googleapis.com">
<link rel="preconnect" href="https://fonts.gstatic.com" crossorigin>
<link rel="preload" as="style" href="https://fonts.googleapis.com/css2?family=Inter:wght@400;600;700&display=swap">
<link rel="stylesheet" href="https://fonts.googleapis.com/css2?family=Inter:wght@400;600;700&display=swap" media="print" onload="this.media='all'">
We also eliminated 2 of the 4 font families entirely — they were being loaded but not visibly used anywhere on the site.
Day 6–7 — Testing and Fine-tuning
We ran PageSpeed Insights, GTmetrix, and WebPageTest across 3 different connection speeds and locations. Minor adjustments to caching rules and image sizes based on the results.
The Results
| Metric | Before | After | Improvement |
|---|---|---|---|
| Load Time (Mobile) | 7.2s | 2.9s | 60% faster |
| LCP | 6.8s | 2.1s | 69% improvement |
| CLS | 0.42 | 0.04 | 90% improvement |
| FID | 380ms | 62ms | 84% improvement |
| PageSpeed Score (Mobile) | 18/100 | 76/100 | +58 points |
| Google Ranking (target keyword) | Page 4 | Page 1 | 3 weeks later |
What Made the Biggest Difference
In order of impact:
- Image optimization — single biggest win, easiest to implement
- Caching — eliminated the database bottleneck completely
- CDN — critical for Indian sites serving Indian visitors
- Plugin cleanup — often overlooked but significant
- Font optimization — smaller gain but easy to implement
Tools We Used
| Tool | Purpose | Cost |
|---|---|---|
| Google PageSpeed Insights | Audit and scoring | Free |
| GTmetrix | Waterfall analysis | Free |
| ShortPixel | Image compression | Paid (worth it) |
| LiteSpeed Cache | Full page caching | Free |
| Cloudflare | CDN + WAF | Free |
| Asset CleanUp Pro | Script management | Paid |
Can You Do This Yourself?
Yes — the image optimization, caching, and Cloudflare steps are straightforward and free. Most WordPress site owners can get a 30–40% improvement just from those three changes in an afternoon.
The more complex optimizations — plugin script management, font loading, server-level caching — benefit from a developer’s eye. If your site is business-critical and you want guaranteed results, our team can run the full audit and optimization for you.
Leave a comment